|
| Exemplo de plotar um Grafico |
| Débuté par Boller, 26 sep. 2020 14:05 - 1 réponse |
| |
| | | |
|
| |
Membre enregistré
3 655 messages
Popularité : +175 (223 votes) |
|
Posté le 26 septembre 2020 - 14:05 |
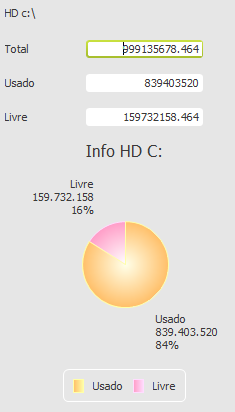
EDT_HD_Total = Val(fDriveInfo("C:", fdTotalSpace))/1000
EDT_HD_Livre = Val(fDriveInfo("C:", fdFreeSpace))/1000
EDT_HD_Usado = Val(Val(EDT_HD_Total) - Val(EDT_HD_Livre))
grTitle(CHART_HD, "Info HD C:")
IF grExist(CHART_HD) THEN
grDeleteSeries(CHART_HD)
grDeleteAll(CHART_HD)
grClearPict(CHART_HD)
END
grLabel(CHART_HD, grShowValue, True)
grSeriesLabel(CHART_HD,1,"Usado")
grSeriesLabel(CHART_HD,2,"Livre")
grCategoryLabel(CHART_HD,1,"Usado")
grCategoryLabel(CHART_HD,2,"Livre")
grLegend(CHART_HD,grAtBottom)
grLabel(CHART_HD, grShowPercent, True)
grSeriesColor(CHART_HD, 1, GetColor(1,RGB(255,0,0)))
grSeriesColor(CHART_HD, 2, GetColor(2,RGB(0,0,255)))
grAddData(CHART_HD,1,Val(EDT_HD_Usado))
grAddData(CHART_HD,1,Val(EDT_HD_Livre))
grDraw(CHART_H
--
Adriano José Boller
______________________________________________
Consultor e Representante Oficial da
PcSoft no Brasil
+55 (41) 99949 1800
adrianoboller@gmail.com
skype: adrianoboller
http://wxinformatica.com.br/ |
| |
| |
| | | |
|
| | |
| |
Posté le 14 septembre 2022 - 23:57 |
Gracias Adriano, muy útil.
Puedes darme un ejemplo de graddData
para un Gráfico Bubble en WM.
Necesito graficar dos variables numéricas en
Ejes X e Y y la tercera , “estado” con valores 1, 2 o 3
que me de el tamaño de la burbuja.
Cualquier dato a mi correo
Clizana@cooprinsem.cl
Muito obrigado,
Carlos Lizana |
| |
| |
| | | |
|
| | | | |
| | |
|