|
| OpenStreetMap se positionner sur marqueur suite double clic sur table |
| Iniciado por BrunoPqs, abr., 21 2024 10:11 AM - 2 respostas |
| |
| | | |
|
| |
Membro registado
42 mensagems |
|
Publicado em abril, 21 2024 - 10:11 AM |
Bonjour,
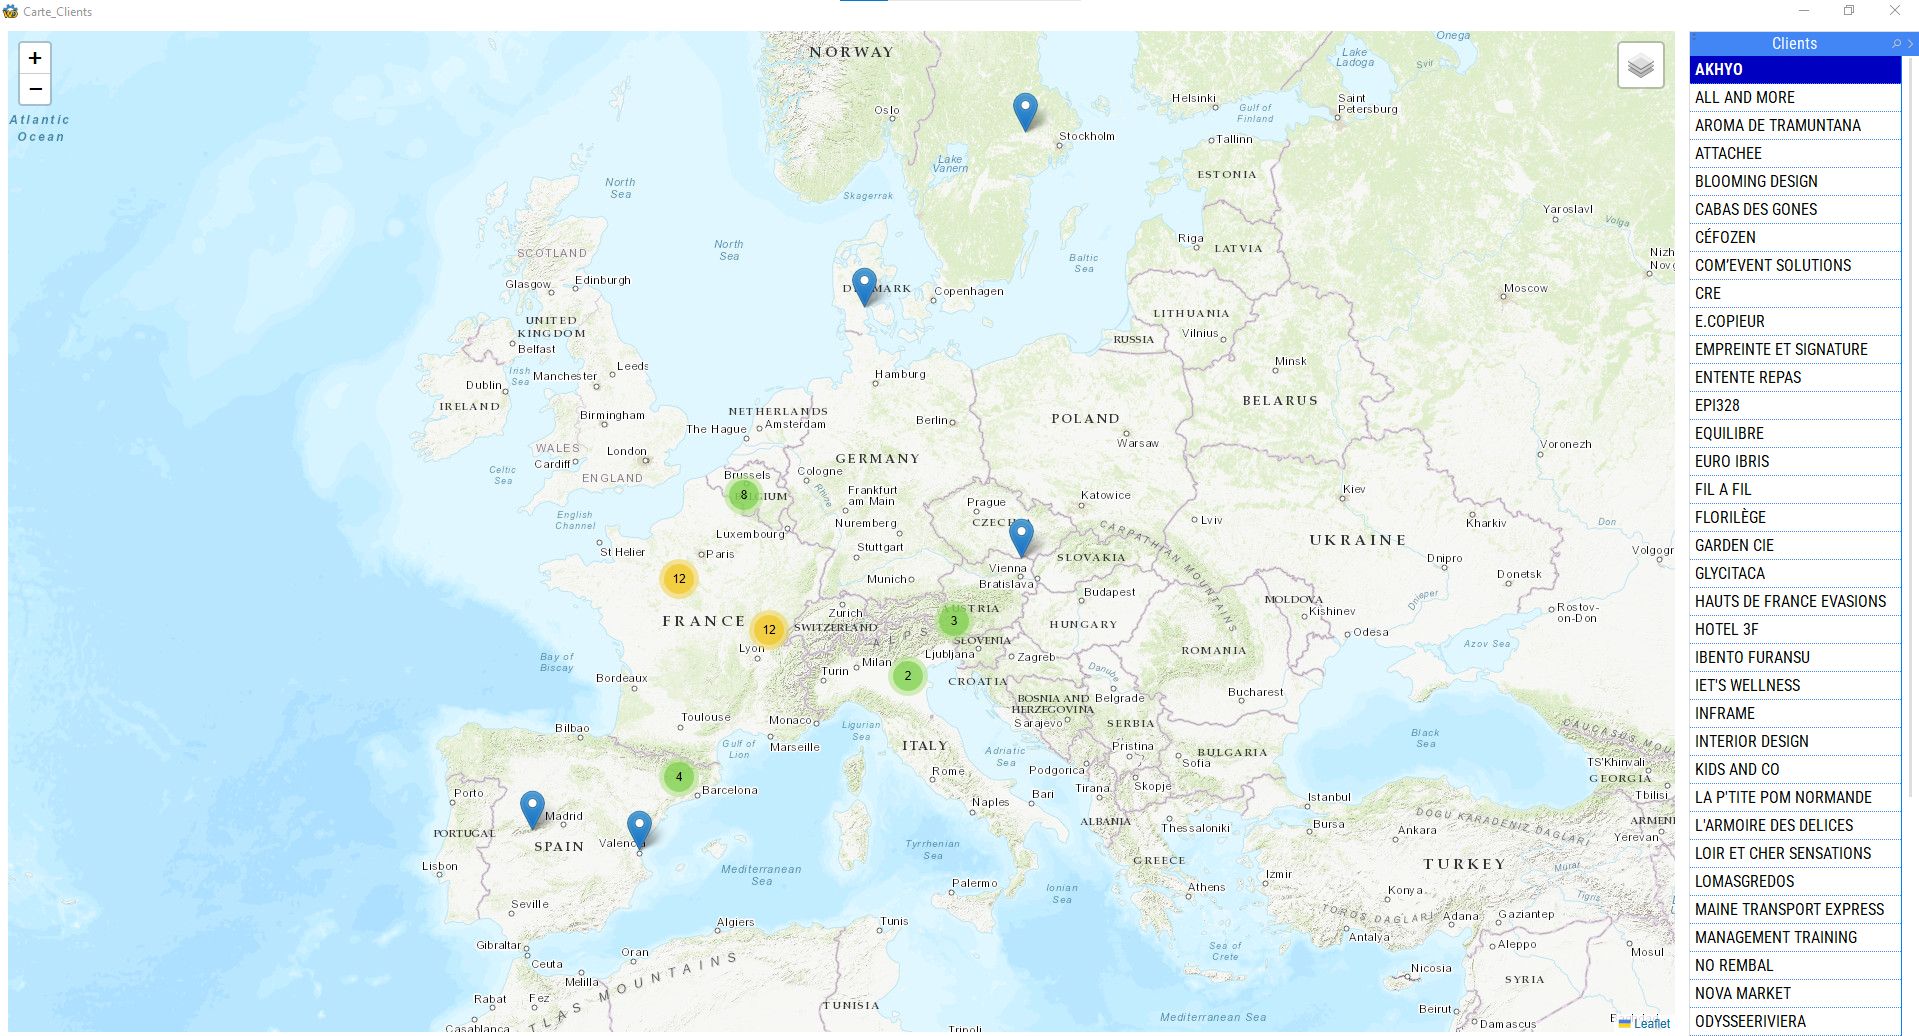
Avec la grande aide de Cedric_34 sur mon projet pédagogique formation secrétaire ; je me demandais s'il était possible de double cliquer sur le nom d'une entreprise dans la table et que le zoom se fasse sur la carte OpenStreetMap ?
Voici le code à ce jour et une image de la fenêtre :
ChaineJS est une chaîne
ChaineJS2 est une chaîne
ChaineJS3 est une chaîne
HTML1 = "<html></html>"
ChaineJS = [
<html>
<head>
<title>Carte Leaflet</title>
<link rel="stylesheet" href="https://unpkg.com/leaflet@1.9.4/dist/leaflet.css"/>
<script src="https://unpkg.com/leaflet@1.9.4/dist/leaflet.js"></script>
<link rel="stylesheet" href="https://unpkg.com/leaflet.markercluster@1.5.3/dist/MarkerCluster.css">
<link rel="stylesheet" href="https://unpkg.com/leaflet.markercluster@1.5.3/dist/MarkerCluster.Default.css" />
<script src="https://unpkg.com/leaflet.markercluster@1.5.3/dist/leaflet.markercluster.js"></script>
</head>
<body>
<div id="CarteID" style="height:100%;width:100%;"></div>
<script>
var DataMarkers = [
]
POUR TOUT CLIENT
ChaineJS2+="["+CLIENT.Latitude+","+CLIENT.Longitude+","+Caract(34) +CLIENT.NomClt+Caract(34) +","+Caract(34) +CLIENT.Lien_HTTP+Caract(34) +","+Caract(34) +CLIENT.Lien_Logo+Caract(34) +"],"+RC
FIN
ChaineJS2 = Remplace(ChaineJS2,Taille(ChaineJS2) -2,1,"];")
ChaineJS3 = [
var MaCarte = L.map('CarteID').setView([49.5, 8.5],5);
var baselayers = {
OSM:L.tileLayer('https:
OSM_Hot:L.tileLayer('http:
openTopoMap:L.tileLayer('https:
ESRI:L.tileLayer('http:
;baselayers.ESRI.addTo(MaCarte);
var Groupemarkers=L.markerClusterGroup();
Groupemarkers.on("click",markerOnClick);
for(var i=0;i<DataMarkers.length;i++) {
var oneMarker = L.marker([DataMarkers[i][0],DataMarkers[i][1]]).bindTooltip("<h3>"+DataMarkers[i][2] +"</h3> <img src='./Logos/"+DataMarkers[i][4] +"' />");
oneMarker.properties = {};
oneMarker.properties.LienHTTP = DataMarkers[i][3];
oneMarker.addTo(Groupemarkers);
}
var Marqueurs=L.layerGroup();
Groupemarkers.addTo(Marqueurs);
var overlays= {
'Marqueurs':Marqueurs
}
;overlays.Marqueurs.addTo(MaCarte);
L.control.layers(baselayers,overlays).addTo(MaCarte);
FUNCTION markerOnClick(e) {
var attributes=e.layer.properties;
window.open(attributes.LienHTTP);
}
</script>
</body>
</html>
]
ChaineJS+=ChaineJS2+ChaineJS3
fSauveTexte(ComplèteRep(fRepExe()) +"LeafLet_Carte.html",ChaineJS)
HTML1=ComplèteRep(fRepExe()) +"LeafLet_Carte.html"
Cdlmt,
Bruno |
| |
| |
| | | |
|
| | |
| |
Membro registado
553 mensagems |
|
Publicado em abril, 22 2024 - 3:26 PM |
Bonjour Bruno,
j'attendais de voir si vous aviez une proposition d'une autre personne mais bon, je vais vous donner une solution.
Il y a probablement d'autres moyens mais je n'ai pas cherché plus loin.
Donc, il faut savoir qu'une seule ligne dans le code centre et zoom la carte, c'est celle-ci :
var MaCarte = L.map('CarteID').setView([49.5, 8.5],5);
Vous pouvez donc modifier cette seule ligne dans le code lorsque vous double cliquez sur la Table pour atteindre votre objectif.
49.5, 8.5 représentent la latitude et la longitude de centrage
5 représente le niveau de zoom (plus le chiffre est important, plus vous zoomez, vous pouvez aller jusqu'à 18 il me semble (c'est la valeur que j'ai fixé dans le code pour chaque type de carte : {minZoom: 2, maxZoom: 18}))
Je pars du principe que vous avez dans votre table les rubriques "Latitude" et "Longitude" en colonnes invisibles.
Pour ce faire, voici le code modifié :
1° - Dans le code de la fenêtre, déclarez 2 variables dans l'évènement : Déclarations globales de <<fenêtre>>
MaLatitude est une chaîne
MaLongitude est une chaîne
2° - Dans le code de la table, dans l'évènement : Bouton gauche Double-clic sur la table
MaLatitude = Table_CLIENT.Latitude
MaLongitude = Table_CLIENT.Longitude
ChaineJS est une chaîne
ChaineJS2 est une chaîne
ChaineJS3 est une chaîne
ChaineJS4 est une chaîne
HTML1 = "<html></html>"
ChaineJS = [
<html>
<head>
<title>Carte Leaflet</title>
<link rel="stylesheet" href="https://unpkg.com/leaflet@1.9.4/dist/leaflet.css"/>
<script src="https://unpkg.com/leaflet@1.9.4/dist/leaflet.js"></script>
<link rel="stylesheet" href="https://unpkg.com/leaflet.markercluster@1.5.3/dist/MarkerCluster.css">
<link rel="stylesheet" href="https://unpkg.com/leaflet.markercluster@1.5.3/dist/MarkerCluster.Default.css" />
<script src="https://unpkg.com/leaflet.markercluster@1.5.3/dist/leaflet.markercluster.js"></script>
</head>
<body>
<div id="CarteID" style="height:100%;width:100%;"></div>
<script>
var DataMarkers = [
]
POUR TOUT CLIENT
ChaineJS2+= "[" + CLIENT.Latitude + "," + CLIENT.Longitude + "," + Caract(34) + CLIENT.NomClt + Caract(34) + "," + Caract(34) + CLIENT.Lien_HTTP+Caract(34) + "," + Caract(34) + CLIENT.Lien_Logo + Caract(34) + "]," + RC
FIN
ChaineJS2 = Remplace(ChaineJS2,Taille(ChaineJS2) -2,1,"];")
ChaineJS4 = [
var MaCarte = L.map('CarteID').setView([%1, %2],17);
]
ChaineJS4 = ChaîneConstruit(ChaineJS4, MaLatitude, MaLongitude)
ChaineJS3 = [
var baselayers = {
OSM:L.tileLayer('https://{s}.tile.openstreetmap.org/{z}/{x}/{y}.png', {minZoom: 2, maxZoom: 18}),
OSM_Hot:L.tileLayer('http://{s}.tile.openstreetmap.fr/hot/{z}/{x}/{y}.png', {minZoom: 2, maxZoom: 18}),
openTopoMap:L.tileLayer('https://{s}.tile.opentopomap.org/{z}/{x}/{y}.png', {minZoom: 2, maxZoom: 18}),
ESRI:L.tileLayer('http://server.arcgisonline.com/ArcGIS/rest/services/World_Topo_Map/MapServer/tile/{z}/{y}/{x}', {minZoom: 2, maxZoom: 18})}
;baselayers.ESRI.addTo(MaCarte);
var Groupemarkers=L.markerClusterGroup();
Groupemarkers.on("click",markerOnClick);
for(var i=0;i<DataMarkers.length;i++) {
var oneMarker = L.marker([DataMarkers[i][0],DataMarkers[i][1]]).bindTooltip("<h3>"+DataMarkers[i][2] +"</h3> <img src='./Logos/"+DataMarkers[i][4] +"' />");
oneMarker.properties = {};
oneMarker.properties.LienHTTP = DataMarkers[i][3];
oneMarker.addTo(Groupemarkers);
}
var Marqueurs=L.layerGroup();
Groupemarkers.addTo(Marqueurs);
var overlays= {
'Marqueurs':Marqueurs
}
;overlays.Marqueurs.addTo(MaCarte);
L.control.layers(baselayers,overlays).addTo(MaCarte);
FUNCTION markerOnClick(e) {
var attributes=e.layer.properties;
window.open(attributes.LienHTTP);
}
</script>
</body>
</html>
]
ChaineJS += ChaineJS2 + ChaineJS4 + ChaineJS3
fSauveTexte(ComplèteRep(fRepExe()) +"LeafLet_Carte_Zoom.html",ChaineJS)
HTML1=ComplèteRep(fRepExe()) +"LeafLet_Carte_Zoom.html"
PS : comme d'habitude, n'oubliez pas FUNCTION à remettre en minuscule
Je suis allé au plus rapide mais vous pourriez placer le code dans une procédure.
J'ai fait le choix de donner un autre nom au fichier html "LeafLet_Carte_Zoom.html",
de cette manière vous pouvez revenir à la carte générale avec :
HTML1=ComplèteRep(fRepExe()) +"LeafLet_Carte.html"
Une bonne pratique serait de conserver les données de la variables ChaineJS2 dans une variable globale à la fenêtre pour ne pas faire appel au fichier HFSQL à chaque zoom sur un client.
Enfin, je vois que vous avez fait le choix d'ouvrir les sites dans le navigateur Windows, sachez que vous pourriez choisir votre navigateur en appelant une procédure (pour un navigateur autre que Internet Explorer) :
par exemple, pour Chrome :
sUrl est une chaîne ="XXX.com/"
sNavigateur est un entier = LanceAppli("C:\Program Files (x86)\Google\Chrome\Application\chrome.exe " + sUrl)
ou EDGE :
sNavigateur est un entier = LanceAppli("C:\Program Files (x86)\Microsoft\Edge\Application\msedge.exe " + sUrl)
CdltMensagem modificada, abril, 22 2024 - 3:29 PM |
| |
| |
| | | |
|
| | |
| |
Membro registado
42 mensagems |
|
Publicado em abril, 27 2024 - 6:27 PM |
Bonsoir Cédric,
Ca marche parfaitement.
Merci encore.
Cdmt,
Bruno |
| |
| |
| | | |
|
| | | | |
| | |
|